EEG screening and real-time monitoring - sonification details
Introduction
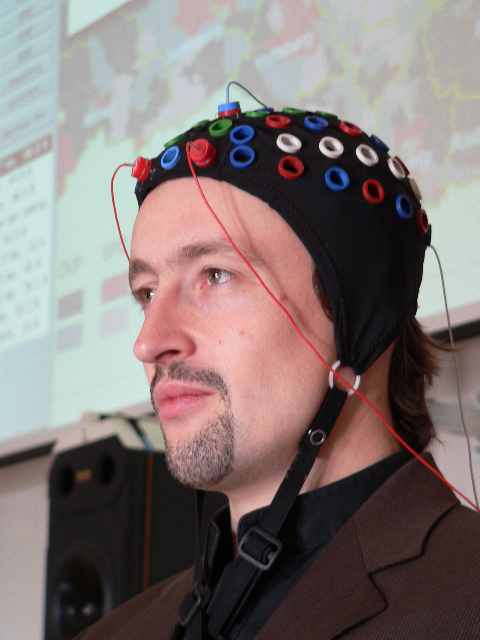
EEG is short for Electro-Encephalogram, i.e. registration of the electrical signals coming from the brain that can be measured on the human skull. There are so-called 10-20 system, which spaces electrodes on similar distances over the skull (see e.g.EbeHomma and many other textbooks.
The signal from a single electrode is often analysed in terms of its characteristic frequency band components: The useful frequency range is typically given as 1-30 Hz, sometimes extended a little higher and lower. Within this range, different frequency bands have been associated with particular activities and brain states; e.g. the 'alpha' range is between 8 and 13 Hz, associated with general state of relaxedness, and non-activity of the brain region for visual tasks; it is most prominent with eyes closed.
For both sonification designs presented, we split the EEG signal into frequency ranges which closely correspond to the traditional EEG bands; we decided to use equal bandwidths of one octave each to attain a more equal energy balance between the bands. The ranges are:
- deltaL(ow)} from 1 - 2 Hz,
- deltaH(igh) from 2 - 4 Hz,
- theta from 4 - 8 Hz,
- alpha from 8 - 16 Hz (this is a bit wider than the traditional value of 13, and includes the mu-rhythm band),
- beta from 16 - 32 Hz, and finally gamma from 32 - 64 Hz.
The EEG Screening
For a number of neurological problems, it is standard practice to record longer time stretches of brain activity. A stationary recording (as made at our partner institution) usually last more than 12 waking hours; night recordings usually are longer, up to 36 hours. These recordings are then visually screened, i.e. looked through in 20-30 second frames at a time; this process is both demanding and slow.
With visual and auditory screening combined, the risk of not noticing important events in the recorded brain activity is lowered.
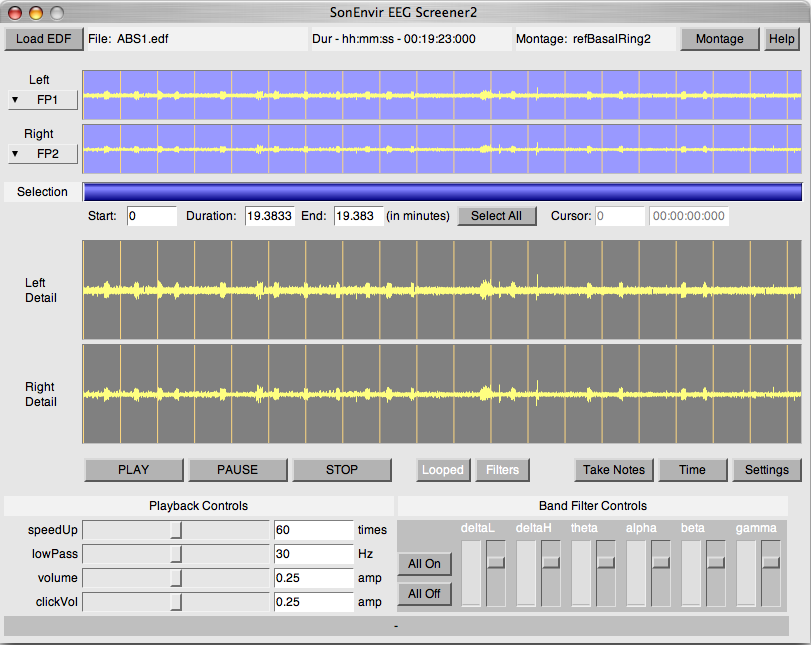
For rapid EEG data screening, there is little need for an elaborate sonification design:
- As the signal to be sonified is a time signal, and a signal speed of some 10000s of points per seconds is deemed useful for screening, straightforward audification is the obvious choice. With sampling rates around 250 Hz, a typical speedup factor is 60x faster than real time, which transposes our center band (alpha, 8-16Hz) to 480-960 Hz, well in the middle of the audible range. For more time resolution, one can go down to 10x, or for more speedup, up to 360x. This leaves the inner EEG bands still in the audible range.
- A lowpass filter is available from 12 to 75 Hz, default at 30 Hz, to provide the equivalent of visual smoothing used in EEG viewer software.
- A choice is provided between the straight audified signal, and a mix of six equal-bandwidth layers, which can all be individually controlled in volume. This allows both for focused listening to individual bands of interest, and for identification of the EEG band a particular audible component belongs to.
- The task analysis for the Screener demanded the graphical user interface to be simple to use (low-effort, little training needed), error-free, fast, and to provide for keeping reproducible results.
Audio example - EEG Screening
This sound example offers an impression of retrospecive EEG screening of a pathological EEG, including many short absence seizures. With a speed up factor of 90, the absence events can be easily heard.
EEG Realtime Monitoring
A second scenario that benefits from sonification is realtime monitoring while recording EEG data. This is a long-term attention task: an assistant stays in a monitor room next to the room where the patient is being recorded; s/he watches both a video camera view of the patient, and the incoming EEG data on two screens.
In the event of atypical EEG activity (which must be noticed, so one can intervene if necessary), a patient may or may not show peculiar physical movements. Thus watching the video camera, one can miss atypical EEG activity for a while.
Here, sonification is potentially very useful, because it can alleviate constant attention demands: One can easily habituate to a background soundscape, which is known to represent 'everything is normal'. When changes in brain activity occur, the soundscape changes (in most cases, activity is increased, which increases both volume and brightness), and this change in the acoustic environment automatically draws attention.
A sonification design that aims to render EEG data in real time is also useful for studying brain activity as recorded by EEG devices at its natural speed: One can easily portray activity in the traditional EEG frequency acoustically; as many of the phenomena are described as rhythmical, auditory presentation is particularly appropriate here.
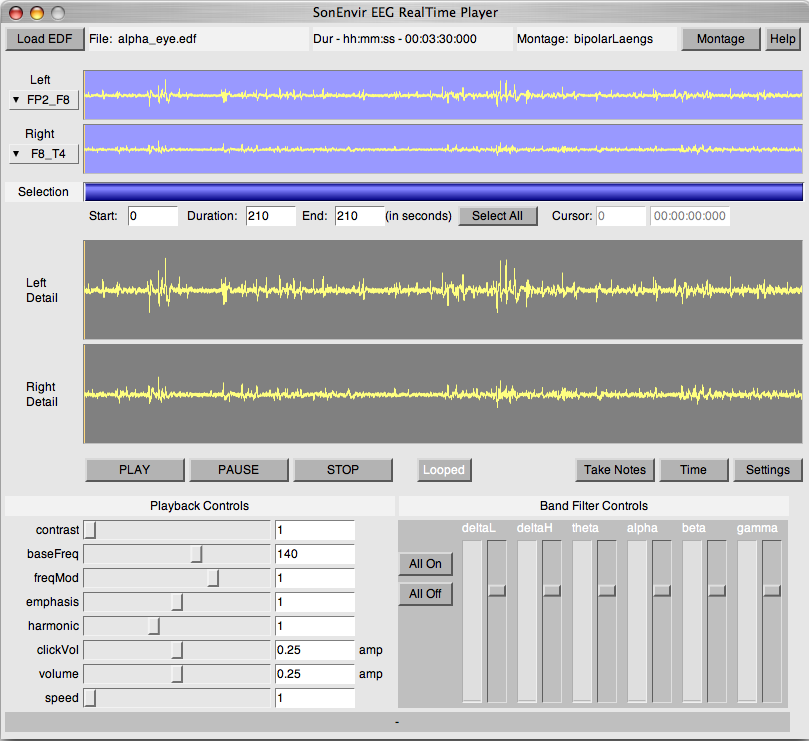
The sonification design for real time monitoring is much more elaborate than the screener. It was prototyped in MATLAB and then implemented for realtime in SuperCollider (SC3).
- The EEG signal of each channel listened to is split into six bands of equal relative bandwidth (one octave, 1-2, 2-4, up to 32-64 Hz), largely following standard EEG terminology. Each band is sonified with its own oscillator and a specific carrier frequency: based on a user-accessible fundamental frequency baseFreq, the carriers are by default multiples of baseFreq by 1, 2, .. 6. If one wants to achieve more perceptual separation between the individual bands, one can deform this overtone pattern with a stretch factor harmonic, where 1 is overtone tuning.
- The carrier frequency in each band is also modulated with the band-filtered EEG signal, thus creating a representation of the signal shape details as deviation from center pitch; the modulation depth is called freqMod. The amplitude of each oscillator band is determined by the amplitude extracted from the corresponding filter-band, optionally stretched by an expansion factor contrast; this creates a stronger foreground/background effect between low-energy bands and bands with more activity.
- For realtime monitoring as a background task, an additional option for emphasis is realised: high activity levels activate an extra sideband modulation at carFreq * 0.25, which creates a new fundamental frequency two octaves lower. This should be difficult to miss.
- Finally, for file playback, crossing the loop point of the current selection is acoustically rendered as a bell-like tone.
Considering the Interface design, most elements (buttons, text displays and signal views) have the same functions as in the EEGScreener; this overlap is intended to reduce learning time for medical personnel using both applications. The main differences to the EEGScreener are: the default time unit is seconds here, not minutes (because this is the more convenient unit for realtime sonification); there is no button „Filters/Bypass“ (because there is no unfiltered signal to listen to); and there are many more playback controls, since the sonification model (as described above) is much more complex.
Audio example - EEG Realtime Player
This sound example uses a normal EEG as demonstration for the realtime sonification. Within this normal EEG there are some motor artefacts as a result of eye blinking, what can be heard in a change of the very harmonic sound.
For both Realtime Player and Screener, we plan for eventual integration into the EEG administration software used at our clinic once the design work is finalized.
References
For a detailed description please refer to:
A.de Campo, A. Wallisch, 2007. New Tools for EEG Data Screening and Monitoring. A paper submitted to the 13th International Conference on Auditory Display 2007.